Table of Contents
Get Started
If you are new to g2nb, we recommend checking out some of our tutorial notebooks below:
Tutorial Notebooks
| Notebook | Description | Link |
|---|---|---|
| g2nb Tutorial | A tutorial on how to use the basic features of the g2nb environment. | |
| Introduction to Text and Document Formatting | A tutorial on the text/document features specific to g2nb | |
| UI Builder Tutorial | A tutorial of how to use the UI Builder, aimed at notebook authors with programmatic skill. | |
| Programmatic Features | A tutorial on the notebook features catering to programmers | |
| GenePattern Files in Python | A tutorial on how to programmatically use g2nb files in conjunction with common Python libraries, such as csv, numpy, pandas and matplotlib. |
Preprocessing
Alignment
| Tool | Input | Output | Quantitation | Details | Documentation | Reference |
|---|---|---|---|---|---|---|
| STAR.aligner | FASTA/FASTQ | SAM/BAM | STAR (Spliced Transcripts Alignment to a Reference) 2.5.3a is a fast RNA-seq reads to genome mapper. | |||
| Kallisto | FASTA/FASTQ | TSV/CSV (Transcript-level and gene-level abundance) | Bare-bones implementation of kallisto, intended to be used for RNA quantitation against a human index. | |||
| HISAT2.aligner | FASTA/FASTQ | SAM | HISAT2 is a fast and sensitive alignment program for mapping next-generation sequencing reads (both DNA and RNA) to a population of human genomes (as well as to a single reference genome). | |||
| TopHat | FASTA/FASTQ | BAM/BED | TopHat 2.0.11 is a fast splice junction mapper for RNA-Seq reads. |
QC/Filtering
| Tool | Input | Filtering | Normalization | Details | Documentation | Reference |
|---|---|---|---|---|---|---|
| FastQC | FASTQ, SAM, or BAM | FastQC takes sequencing data as input and returns a report on read quality. | ||||
| Seurat.QC | Seurat.QC allows you to explore QC metrics based on any user-defined criteria. A few QC metrics commonly used by the community include: unique feature counts, mitochondrial counts, total number of molecules detected within a cell. Source | |||||
| Seurat.Preprocessing | log-normalize | Seurat.Preprocessing allows you to explore QC metrics and filter cells based on any user-defined criteria. See Seurat.QC for more info. | ||||
| Trimmomatic | Provides a variety of options for trimming Illumina FASTQ files of adapter sequences and low-quality reads. | |||||
| ScanpyUtilities | See Documentation | Single-cell preprocessing (annotation and filtering) GenePattern module using Scanpy | ||||
| HTSeq.Count | SAM/BAM and GTF/GFF |
Single Cell Analysis
Seurat Suite
Seurat (https://satijalab.org/seurat/) is an R package designed for QC, analysis, and exploration of single-cell RNA-seq data. Seurat aims to enable users to identify and interpret sources of heterogeneity from single-cell transcriptomic measurements, and to integrate diverse types of single-cell data.
Butler et al., Nature Biotechnology 2018
Stuart, Butler et al., Cell 2019
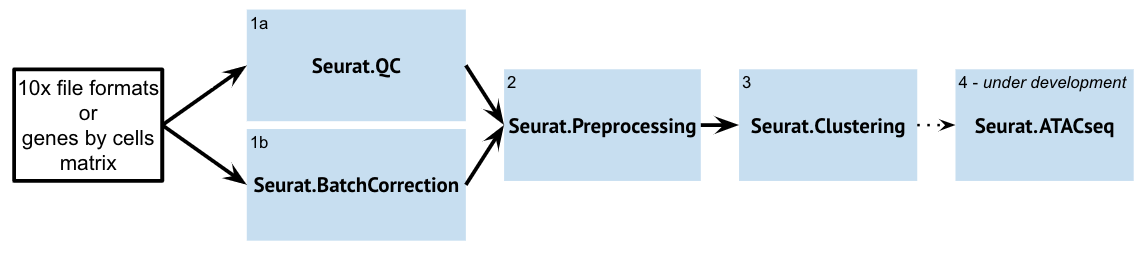
Within GenePattern, Seurat is accessed as several different modules exposing different portions of the Seurat workflow:
| Tool | Description | Documentation |
|---|---|---|
| Seurat.QC | The Seurat.QC Module aims to provide a quick look at some basic single-cell datasets. This is typically the first step in the Seurat Suite modules. The resultant preprocessed dataset can then be used for downstream analyses and visualizations (such as Seurat.Preprocessing). If you are doing batch correction, then you want to run Seurat.BatchCorrection before Seurat.QC. | |
| Seurat.BatchCorrection | The Seurat.BatchCorrection Module aims to integrate / "batch-correct" multiple single-cell datasets and identify shared cell states that are present across different datasets, regardless of their origin. Once the Module integrates these datasets, the returned object will contain a new Assay that holds an integrated / batch-corrected expression matrix for all cells. The resultant batch-corrected expression matrix can then be used for downstream analyses and visualizations. | |
| Seurat.Preprocessing | The Seurat.Preprocessing Module aims to provide a way to integrate the multiple steps in the preprocessing of single-cell datasets. The resultant preprocessed dataset can then be used for downstream analyses and visualizations (Seurat.Clustering). You may need to run this module multiple times if you want to change the filtering step. | |
| SeuratClustering | Seurat.Clustering performs UMAP clustering and marker identification on single-cell RNA-Seq data. The Seurat.Clustering module performs uses Seurat version 3.0.2. It performs following steps from Seurat to the input dataset:
|
STREAM Suite
STREAM (Single-cell Trajectories Reconstruction, Exploration And Mapping) (https://github.com/pinellolab/STREAM) is an interactive pipeline capable of disentangling and visualizing complex branching trajectories from both single-cell transcriptomic and epigenomic data. Within GenePattern, STREAM is implemented as a collection of modules that cover the entire STREAM processing pipeline to allow individual steps to be performed interactively for data exploration.
Chen et al. 2019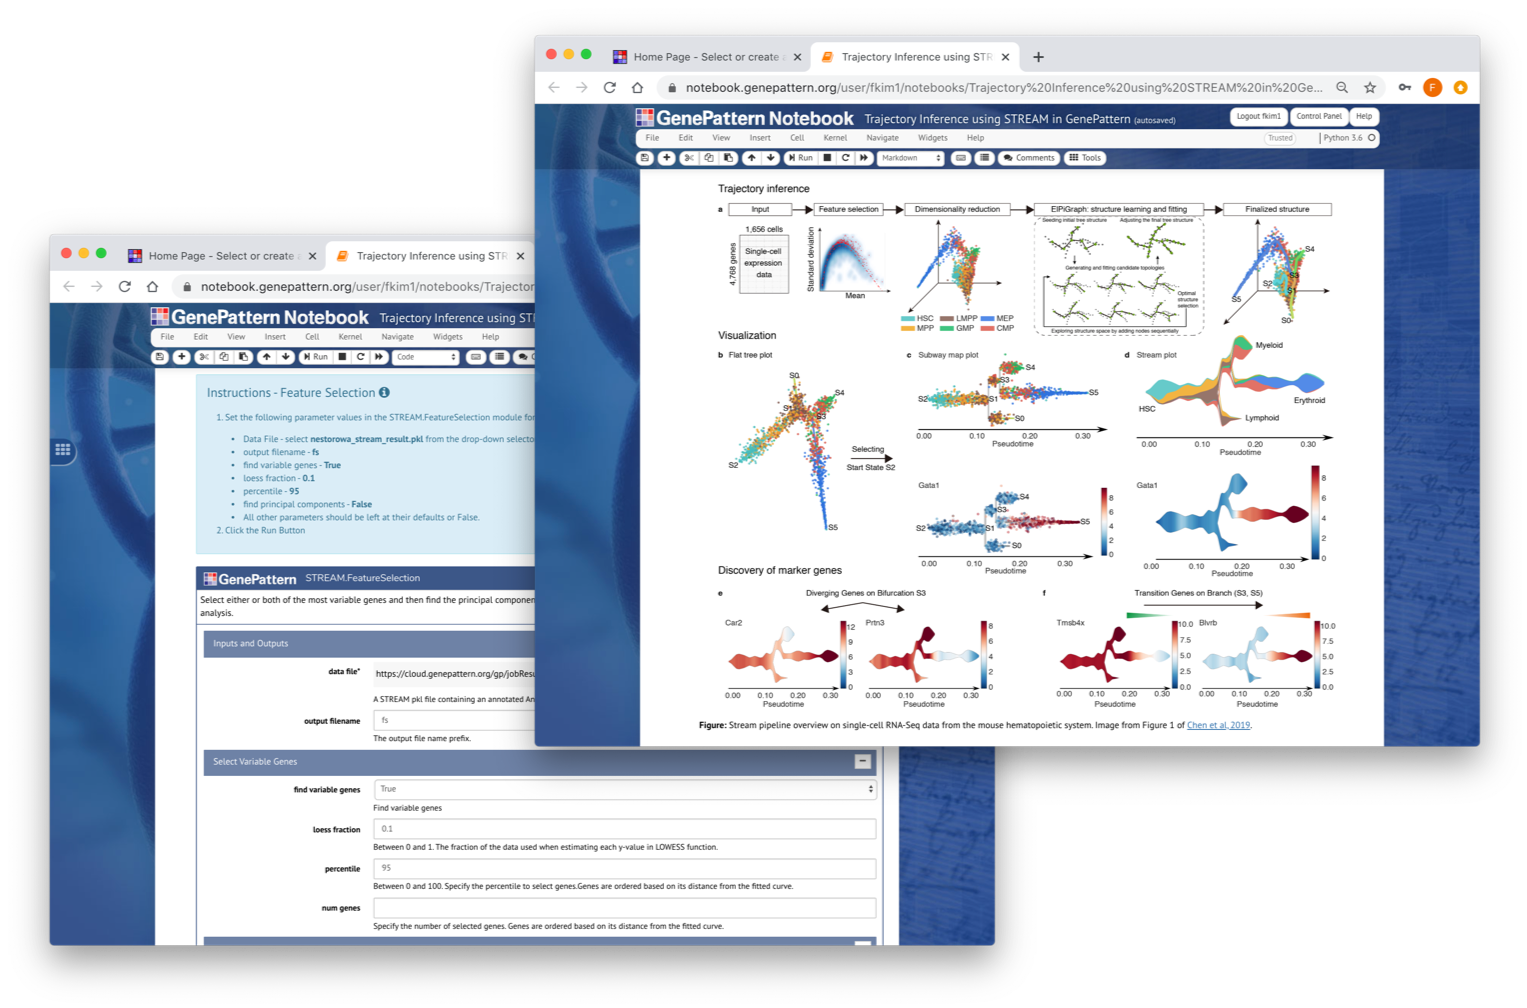
| Tool | Description | Documentation |
|---|---|---|
| STREAM.Preprocess | STREAM.Preprocess will prepare single cell RNA-seq data for the STREAM trajectory analysis. It will normalize, log transform, filter and remove mitochondiral genes. | |
| STREAM.FeatureSelection | STREAM.FeatureSelection is used to identify features to be used in the downstream analysis. Two types of features can be used;
|
|
| STREAM.DimensionReduction | STREAM.DimensionReduction is used to reduce the dimensionality of the dataset to be used in the downstream analysis. | |
| STREAM.Plot2DVisualization | STREAM.Plolt2DVisualization is used check if there is clear meaningful trajectory pattern to the data. If there is, we will continue the downstream analysis placing the cells onto the trajectories. If not, we would go back to previous steps to modify the parameters used to filter and prepare the data to try different settings. | |
| STREAM.SeedEPGStructure | STREAM.SeedEPGStructure is use to seed the initial elastic principal graph prior to starting the trajectory learning process. | |
| STREAM.ElasticPrincipalGraph | STREAM.ElasticPrincipalGraph uses elastic principal graph learning to calculate a pseudotime trajectory. | |
| STREAM.EPGAdjustFinalGraph | STREAM.EPGAdjustFinalGraph facilitates some final adjustments to the graph generated by STREAM.ElasticPrincipalGraph such as optimizing the structure, pruning the final structure or extending leaf nodes. | |
| STREAM.VisualizeTrajectories | STREAM.VisualizeTrajectories is used to generate the subway and stream plots for a computed graph structure. | |
| STREAM.DetectDifferentiallyExpressedGenes | STREAM.DetectDifferentiallyExpressedGenes used to detect differentially expressed genes between pairs of branches. | |
| STREAM.DetectLeafGenes | STREAM.DetectLeafGenes is used to detect marker genes for each leaf branch. | |
| STREAM.DetectTransitionGenes | STREAM.DetectTransitionGenes is used to detect marker genes for each transition. |
CONOS Suite
Conos (Clustering on Network of Samples) (https://github.com/kharchenkolab/conos) is a package to wire together large collections of single-cell RNA-seq datasets, which allows for both the identification of recurrent cell clusters and the propagation of information between datasets in multi-sample or atlas-scale collections. It focuses on the uniform mapping of homologous cell types across heterogeneous sample collections. For instance, users could investigate a collection of dozens of peripheral blood samples from cancer patients combined with dozens of controls, which perhaps includes samples of a related tissue such as lymph nodes.
Barkas et al. 2019
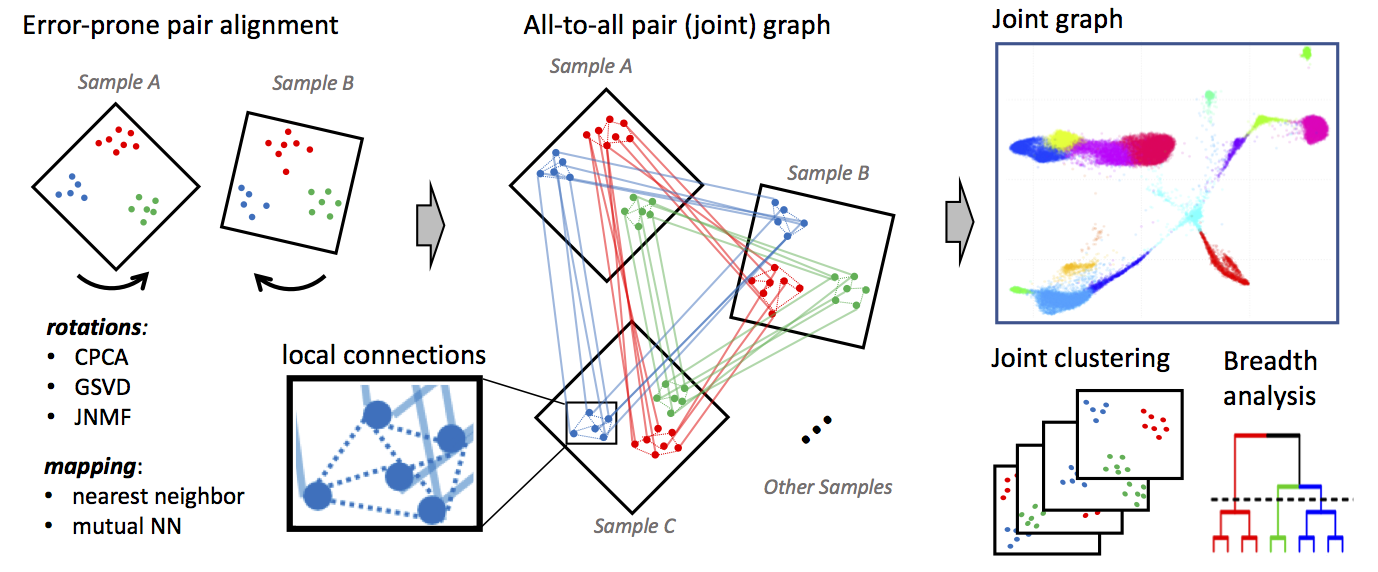
This module will read single cell data (e.g., count files) from different datasets and project each of those datasets into their own PCA space.
| Tool | Description | Documentation |
|---|---|---|
| Conos.Preprocess | Performs independent clustering of each of the single-cell quantification tables using the Pagoda2 method. These clustered results are then projected into C/PCA space and embedded into a joint graph. | |
| Conos.Cluster | Clustering is performed on the joint graph produced as the output of Conos.Preprocess using both Leiden community clustering and Walktrap clustering. The clustered joint graph is then projected into UMAP space for visualiztion. |
ScanpyUtilities
Scanpy (Single Cell Analysis in Python) (https://scanpy.readthedocs.io/en/stable/) is a scalable toolkit for analyzing single-cell gene expression data. It includes preprocessing, visualization, clustering, pseudotime and trajectory inference and differential expression testing. The Python-based implementation efficiently deals with datasets of more than one million cells.
Some common single-cell preprocessing steps require the entire dataset to be loaded into memory which can be an issue on less powerful machines or with larger datasets. This makes it useful to expose ScanPy as a genepattern module where the execution can be offloaded to different, larger, compute resources to perform initial steps to reduce the dataset size before extensive, interactive visualization such as might be done in a GenePattern notebook.
Documentation
Wolf et al. 2018
This module exposes many functions from scanpy version 1.3.3 to be used as a GenePattern module:
| Function | Description |
|---|---|
| Annotation | Add count information to the data file |
| Cell Filtering | Filter out cells based on the various thresholds. |
| Gene Filtering | Filter out genes based on the various thresholds. |
| Cell Type Identification | Run the cell type identification pipeline provided in the R package garnett |
| Normalization | Run the single-cell normalization pipeline provided in the R package scran |
| High Variance Genes | Filter and subset the data to retain only the N most variable genes. |
| Dimension Reduction | Compute UMAP or TSNE coordinates for visualization. |
Visualization Tools (work in progress)
- igv.js
- CytoscapeViewer
- HeatMapViewer
- HierarchicalClusteringViewer